One Line of Rails Config Cut Our Page Load Time by 65%
Our Rails app was shipping uncompressed payloads to every user. One line in an initializer fixed it. Here's why the obvious version of the fix silently fails.

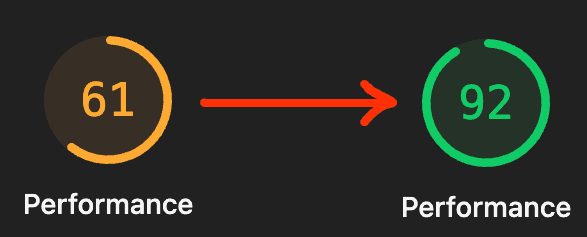
Our inventory page took 4 seconds to start showing content. After one line of Rails config, it takes 1.4. Our Lighthouse Performance score jumped from 61 to 92.
The fix was one line in an initializer file. We didn't touch any controller, any view, any Vue component, or any database query. We turned on gzip.
Some context
MilkStraw AI is an AWS cost optimization and observability platform. Customers connect their AWS accounts, and we show them saving opportunities alongside dashboards for resources, costs, and metrics. Our web app is Rails 8 with Inertia.js and Vue 3, deployed with Kamal.
I was building new CPU charts for the inventory page. Locally everything was fast. After I deployed, I opened DevTools in production and checked one of the API requests. Something felt off.
The suspicious download
Here's what the CPU charts API request looked like in DevTools:
Waiting: ~140 ms
Content Download: ~170 ms
Response size: 77 KB
Waiting is fine. But Content Download of 170 ms for a 77 KB response works out to ~450 KB/s. No real network is that slow. I can download cat videos faster than that.
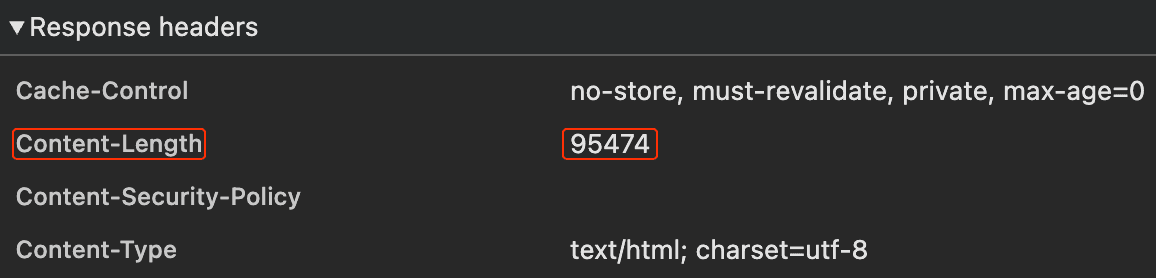
I checked the response headers. No Content-Encoding. The body came back as plain JSON text. Nothing in the request path was compressing anything.
Why our app wasn't compressing
Fresh Rails 8 apps generate with Thruster by default, which handles compression out of the box. We upgraded our app from Rails 7 to 8 without adding Thruster, and Rails itself doesn't compress responses: Rack::Deflater isn't in the default middleware stack. You have to add it yourself.
So every JSON response, every Inertia HTML payload, every static asset served through Rails was going out uncompressed. Every single one.
The one-line fix (and the trap when you verify it)
Every blog post on this topic tells you to add this line to config/application.rb:
I did. Restarted the server. Opened DevTools. Nothing changed. No Content-Encoding header.
Why the obvious placement looks broken
bin/rails middleware showed Rack::Deflater at the bottom of the stack, innermost next to the app. On the way out, Deflater compresses the body first and everything above it processes the gzipped bytes.
One of those things was Rack::MiniProfiler, which we only enable for admin users. MiniProfiler tries to parse the HTML body to inject its badge, the parse fails on gzipped content, and the response reaches the browser as plain text with no Content-Encoding.
So the fix would work for normal users. I just couldn't see it as an admin.
Trying to fix it in application.rb
I tried forcing Deflater to the front of the stack from config/application.rb:
bin/rails middleware now showed Deflater at position 2, not position 0. Still behind MiniProfiler and ViteRuby.
Why? config/application.rb runs before gem railties add their middleware, so my insert_before 0 slotted into an almost-empty stack. Then rack-mini-profiler and vite_ruby ran their own railties and pushed themselves in front.
The real fix: use an initializer
Initializer files in config/initializers/ run after all gem railties have added their middleware. So by the time rack_deflater.rb runs, the stack is fully assembled and insert(0, ...) lands Deflater at the true outermost position. Nothing runs after it to push it back.
The fix is one file:
Restart the server. bin/rails middleware now shows Rack::Deflater as the first middleware in the stack. Open DevTools, reload any page:
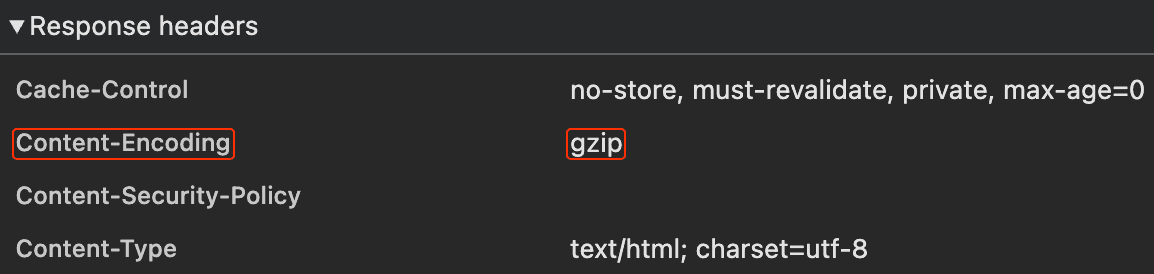
Content-Encoding: gzip shows up. Content-Length disappears because Deflater streams the output in chunks and can't predict the final size upfront.
The 14 KB cliff
Why does one line of config make such a big difference? Because TCP is lazy on purpose.
When a TCP connection starts sending data, it doesn't blast everything at once. It starts with a small initial burst, waits for the client to acknowledge, then doubles the allowed burst, waits again, doubles again. This is called slow start. On modern Linux, the initial burst is 10 packets, which works out to about 14 KB of TCP payload in the first round trip. TLS framing eats into that further.
The consequence:
Up to 14 KB: 1 round trip. Fast.
Up to ~43 KB: 2 round trips. ~50 ms extra on a decent connection.
Up to ~100 KB: 3 round trips. ~100 ms extra.
Bigger than that: more round trips, more waiting.
On localhost you never notice. On mobile or satellite you feel every round trip.
Here's the catch: the 14 KB budget is post-compression. Raw bytes on the wire. Our 77 KB CPU charts response was three rounds of slow start. After gzip it was 9 KB, one round trip. Sudden cliff, not gentle slope.
endtimes.dev has the full version with satellite-internet math and diagrams if you want to go deeper.
The numbers
Medians across three runs, before and after the fix:
Measurement | Before | After | Delta |
|---|---|---|---|
CPU charts API, response size | 77 KB | 9 KB | -88% |
CPU charts API, Content Download | ~170 ms | <1 ms | -99% |
Inertia request (inventory), transferred | 98 KB | 17 KB | -82% |
Inertia request (observability), transferred | 105 KB | 19 KB | -82% |
Lighthouse Performance (inventory) | 61 | 92 | +31 |
Lighthouse Performance (observability) | 61 | 92 | +31 |
Lighthouse FCP (inventory) | 4,011 ms | 1,375 ms | -66% |
Lighthouse LCP (inventory) | 4,510 ms | 1,612 ms | -64% |
Lighthouse FCP (observability) | 4,030 ms | 1,412 ms | -65% |
Lighthouse LCP (observability) | 4,406 ms | 1,632 ms | -63% |
Total page weight (both pages) | ~5.1 MB | ~1.4 MB | -73% |
FCP (First Contentful Paint) is the moment the user sees anything on the page. LCP (Largest Contentful Paint) is the moment the main content is visible. LCP is also one of Google's Core Web Vitals, so it directly affects search ranking.
Lighthouse was running in desktop mode with simulated throttling at 40 ms network latency and 10 Mbps bandwidth. On mobile the gains would look even bigger, since throttled bandwidth makes compression matter more.
One more thing on measurement: I also captured Inertia navigation timings from my own browser on a warm HTTP/2 connection, and the receive times barely moved (3.5 to 2.2 ms on inventory, 4.9 to 0.5 ms on observability). Past slow-start, a 100 KB payload arrives in a few milliseconds regardless. There's no wire time left to save.
The real wins show up in Lighthouse, which simulates a first-time visitor on a throttled network. That's the cold load where slow-start actually bites. And in bandwidth bills you can't see in milliseconds but can see on the invoice.
One line, whole-app effect
The part that surprised us most: total page weight dropped by roughly 3.7 MB per page, not 85 KB.
The HTML document only accounts for ~85 KB of that. The other ~3.6 MB comes from JavaScript chunks, CSS files, Propshaft assets, Vite assets routed through Rails, and JSON API endpoints. Because Rack::Deflater sits at the outermost position, it wraps every single response Rails produces.
One line. One initializer file. 73% fewer bytes shipped on average per page load across the entire app.
A note for server-rendered Rails apps
If your app is traditional server-rendered Rails (not Inertia), your compression wins will probably be even bigger than ours. Every navigation returns a full HTML document, which is usually larger than an Inertia response that only carries the new page's state and data. More bytes going out, more bytes for compression to shrink.
Check your own Rails app
Open DevTools on your production site right now. Click any request. Look for Content-Encoding: gzip in the response headers.
If it's not there, you're shipping uncompressed payloads to every user, right now. Every large response is falling off the 14 KB cliff.
The fix is one file:
Go.